Flowcharts of the Models Logic
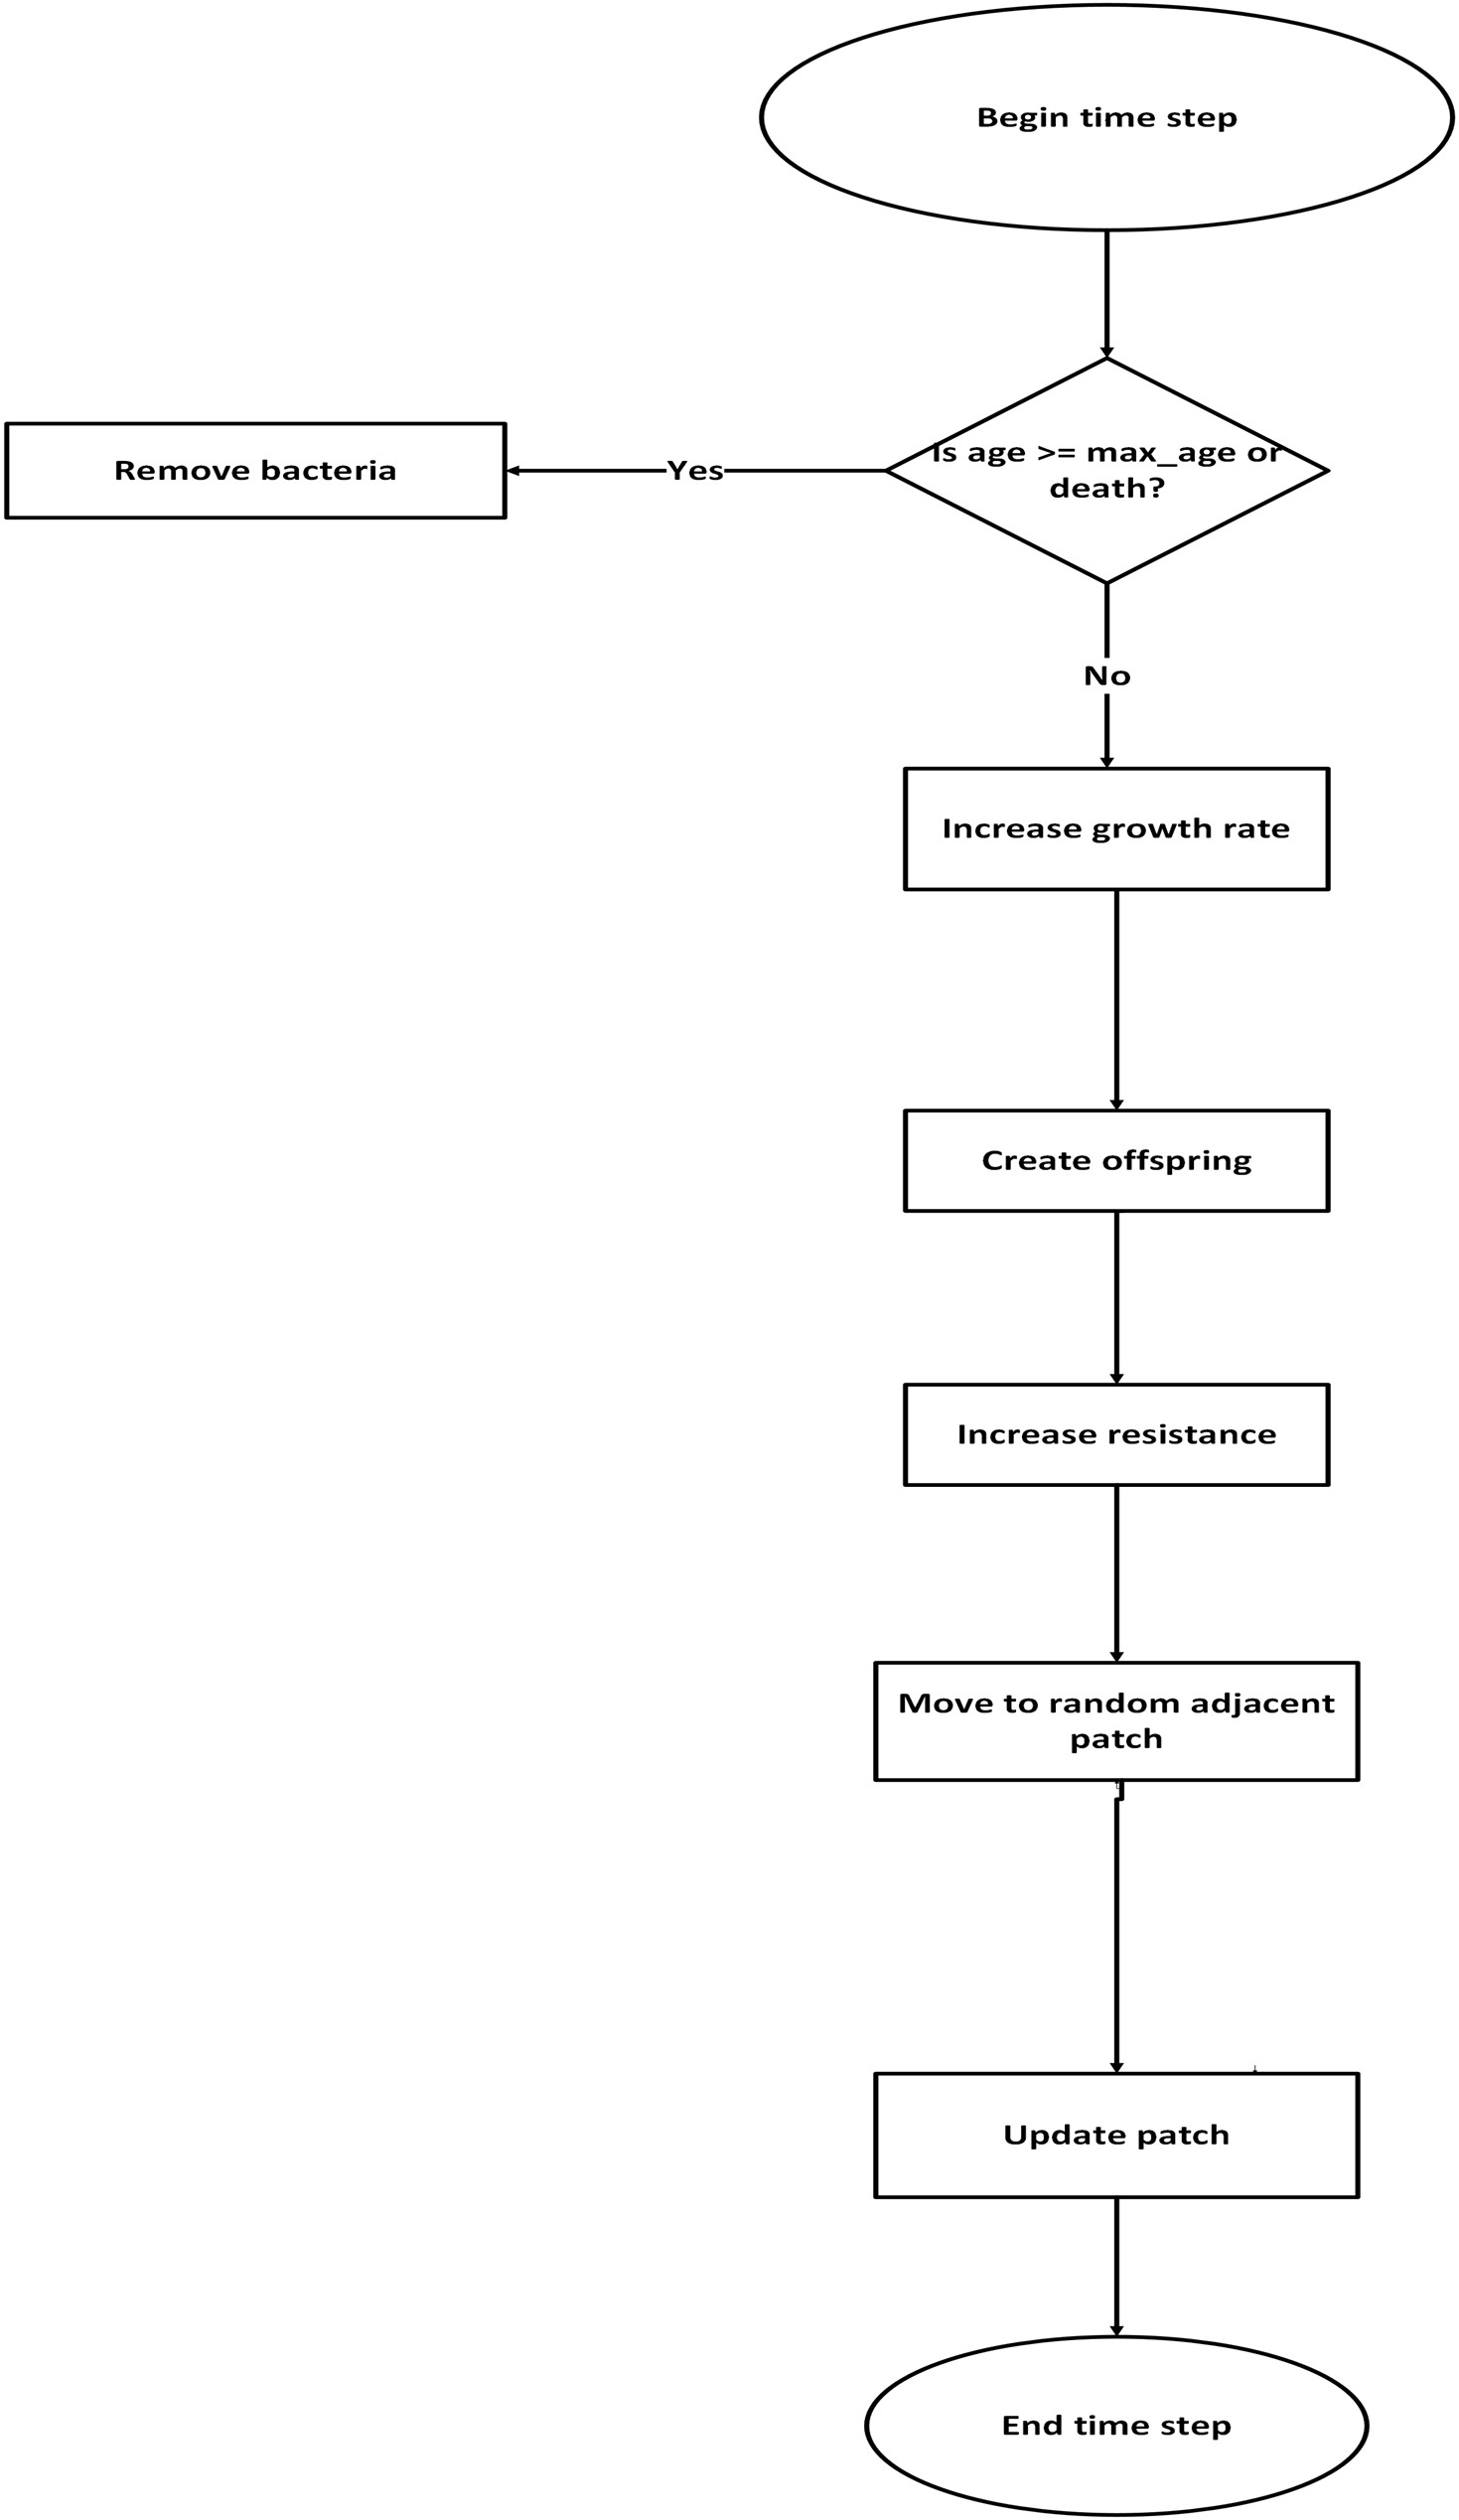
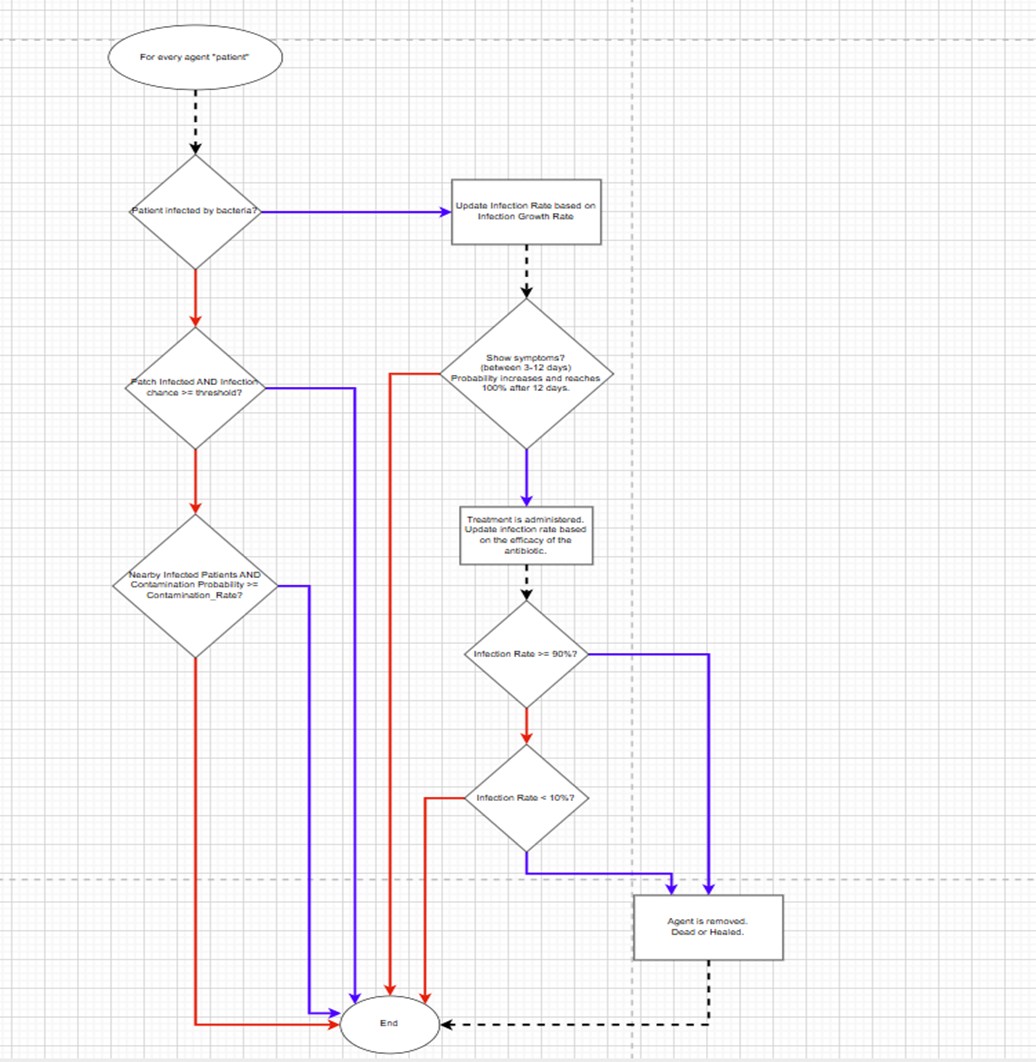
These flowcharts summarize the core logic of our NetLogo model: the left diagram outlines bacteria lifecycle events (growth, mutation, death, and environmental cleaning), and the right diagram shows transmission pathways across human agents (infection, treatment, recovery, and discharge). Together, they provide a high‑level view of how parameters influence outcomes during simulation.
Code
NetLogo Model
globals [
  time-step
  total-mutations
  current-infected
  total-infections
  total-recovered
  percent-total-infected
  initial-population-per-species
  successful-antibiotics
  successful-cleans
  patient-deaths
  total-bacteria
  total-discharged
]

breed [patients patient]
breed [bacteria bacterium]

patches-own [
  patch-density-color
]

patients-own [
  patient-id
  age
  immunocompromised?
  infected?
  pathogen-resistant?
  antibiotic-timer
  alive?
  patient-status
  days-infected
  antibiotic-failures
  healthy-ticks
  ever-healed?
  symptoms?
  symptom-delay           ;; ticks until symptoms appear (300–1200)
  symptom-onset-tick      ;; tick when symptoms started
  antibiotics-after-symptoms-count ;; number of antibiotic administrations after symptoms
]

bacteria-own [
  species
  growth-rate
  death-rate
  carbapenem-resistant?
  bacteria-age
]

to setup
  clear-all
  set-default-shape patients "person"
  set-default-shape bacteria "dot"

  set time-step 0
  set initial-population-per-species 10

  ;; Initialize Counters
  set successful-antibiotics 0
  set successful-cleans 0
  set patient-deaths 0

  setup-environment
  setup-patients
  setup-bacteria
  reset-ticks
end

to setup-environment
  ask patches [
    set pcolor white
    set patch-density-color white
  ]
end

to setup-patients
  create-patients total-patients [
    set size 1.3
    setxy random-xcor random-ycor

    init-patient-vars
  ]
end

to init-patient-vars
  set patient-id who
  set age random 90
  set immunocompromised? (random-float 1 < 0.2)
  set infected? false
  set pathogen-resistant? false
  set antibiotic-timer 0
  set alive? true
  set days-infected 0
  set patient-status "healthy"
  set color green
  set antibiotic-failures 0
  set healthy-ticks 0
  set ever-healed? false
  set symptoms? false
  set symptom-delay 0
  set symptom-onset-tick -1
  set antibiotics-after-symptoms-count 0
end

to setup-bacteria
  let species-list ["Acinetobacter baumannii" "Enterobacteriaceae" "Pseudomonas aeruginosa"]

  foreach species-list [
    this-species ->
    create-bacteria initial-population-per-species [
      set size 0.5
      setxy random-xcor random-ycor
      set species this-species
      set bacteria-age random 10

      set carbapenem-resistant? (random-float 1 < 0.04)

      if species = "Acinetobacter baumannii" [
        set color ifelse-value carbapenem-resistant? [violet] [orange]
      ]
      if species = "Enterobacteriaceae" [
        set color ifelse-value carbapenem-resistant? [red] [pink]
      ]
      if species = "Pseudomonas aeruginosa" [
        set color ifelse-value carbapenem-resistant? [blue] [cyan]
      ]

      ; Adjusted rates to ensure survival between cleanings
      set growth-rate 0.4
      set death-rate 0.4
    ]
  ]
end

to go

  ;; Ensure batch run rules enforced
  ;; Testing

  ;; Stop if total bacteria over 5000 agents ;;
  if total-bacteria > 5000 [ stop ]

  ;; Stop if over 80% patches contaminated
  if (count patches with [count bacteria-here > 0] / count patches) > 0.8 [
  stop
  ]

  ;; Stop if all patients are dead
  if not any? patients with [alive?] [ stop ]

  ;; End testing ;;

  ;; Stop if no bacteria present
  if not any? bacteria [ stop ]

  ;; Continue simulation if none of the stop conditions are met
  set time-step time-step + 1

  ;; Patient Spawning Logic
  if random-float 1 < 0.10 [
    let empty-patches patches with [not any? patients-here]
    if any? empty-patches [
      create-patients 1 [
        move-to one-of empty-patches
        set size 1.3
        init-patient-vars
      ]
    ]
  ]

  ask patients [ patient-behavior ]
  ask bacteria [ bacteria-behavior ]
  ask patches [ environment-behavior ]

  update-globals
  tick
end

to patient-behavior
  if not alive? [ stop ]

  ifelse infected? [
    set patient-status "infected"
    set color red
    set days-infected days-infected + 1
    set antibiotic-timer antibiotic-timer + 1
    set healthy-ticks 0 ; reset since patient is sick

    ;; Symptoms appear between 300 and 1200 ticks post-infection
    ;; Immunocompromised patients show symptoms sooner (bias to shorter window)
    if (not symptoms?) [
      if (symptom-delay = 0) [
        ifelse immunocompromised? [
          set symptom-delay 250 + random 801  ;; ~3–10.5 days
        ] [
          set symptom-delay 300 + random 901  ;; ~3–12 days
        ]
      ]
      if (days-infected >= symptom-delay) [
        set symptoms? true
        set symptom-onset-tick ticks
      ]
    ]

    ;; Allow antibiotics only after symptoms
    if (antibiotic-application and symptoms?) [
      if antibiotic-timer >= antibiotic-administration-period [
        set antibiotic-timer 0
        administer-antibiotics
        set antibiotics-after-symptoms-count antibiotics-after-symptoms-count + 1
      ]
    ]

    ;; Death condition: 700 ticks after symptoms if at least one antibiotic was administered and not cured
    if (symptoms? and (antibiotics-after-symptoms-count >= 1) and ((ticks - symptom-onset-tick) >= 700)) [
      set alive? false
      set patient-deaths patient-deaths + 1
      die
    ]


  ] [
    ;; Healthy patient logic
    check-for-environment-infection
    set patient-status "healthy"
    set color green

    ;; Track consecutive healthy ticks
    set healthy-ticks healthy-ticks + 1

    ;; Leave if healthy for over 100 ticks
    if healthy-ticks >= 100 [
      set total-discharged total-discharged + 1
      die
    ]
  ]
end

to check-for-environment-infection
  ;; Patients who were healed by antibiotics cannot be reinfected
  if ever-healed? [ stop ]

  if count bacteria-here > 0 [
    let base-prob 0.5
    if immunocompromised? [ set base-prob base-prob + 0.2 ]

    if random-float 1 < base-prob [
      set infected? true
      set color red
      set antibiotic-timer 0
      set days-infected 0
      set symptoms? false
      ;; schedule symptoms window with immunocompromised bias
      ifelse immunocompromised? [
        set symptom-delay 250 + random 801
      ] [
        set symptom-delay 300 + random 901
      ]
      set symptom-onset-tick -1
      set antibiotics-after-symptoms-count 0

      let source-bacterium one-of bacteria-here
      set pathogen-resistant? [carbapenem-resistant?] of source-bacterium

      set total-infections total-infections + 1
    ]
  ]
end


to administer-antibiotics
  let success-chance 0

  ;; Base success probability depends on bacterial resistance
  ifelse pathogen-resistant? [
    set success-chance 0.68   ; resistant baseline
  ] [
    set success-chance 0.87   ; non-resistant baseline
  ]

  ;; Immunocompromised patients respond worse (-15%)
  if immunocompromised? [
    set success-chance success-chance - 0.15
  ]

  ;; Example: dosage=10 → +0.33, dosage=50 → +0.71, dosage=100 → +0.83
  set success-chance success-chance + (antibiotic-strength-level / (antibiotic-strength-level + 20))

  ;; Clamp to [0, 1]
  if success-chance > 1 [ set success-chance 1 ]
  if success-chance < 0 [ set success-chance 0 ]

  ;; Roll for outcome
  ifelse random-float 1 < success-chance [
    ;; SUCCESS
    set infected? false
    set pathogen-resistant? false
    set color green
    set patient-status "healed"
    set successful-antibiotics successful-antibiotics + 1
    set total-recovered total-recovered + 1
    set antibiotic-failures 0
    set ever-healed? true   ; NEW: mark patient as immune to reinfection
  ] [
    ;; FAILURE
    set antibiotic-failures antibiotic-failures + 1
    if antibiotic-failures >= 3 [
      set alive? false
      set patient-status "dead"
      set color black
      set patient-deaths patient-deaths + 1
      die
    ]
  ]

end

to bacteria-behavior
  set bacteria-age bacteria-age + 1

  rt random 360
  fd 1

  ;; Mutation chance each tick
  if random-float 1 < 0.01 [
    if not carbapenem-resistant? [
      set carbapenem-resistant? true
      set total-mutations total-mutations + 1

      ;; Update color to resistant variant
      if species = "Acinetobacter baumannii" [ set color violet ]
      if species = "Enterobacteriaceae" [ set color red ]
      if species = "Pseudomonas aeruginosa" [ set color blue ]
    ]
  ]

  if time-step mod 10 = 0 [
    ; 30% chance to duplicate
    if random-float 1 < growth-rate [
      hatch 2 [
        set species [species] of myself
        set carbapenem-resistant? [carbapenem-resistant?] of myself
        set color [color] of myself
        set bacteria-age 0
      ]
      die
      stop
    ]

    ; 50% chance to die off
    if random-float 1 < death-rate [
      die
      stop
    ]
  ]
end

to environment-behavior
  ; 1. CLEANING LOGIC (Only runs every 30 time steps)
  if (time-step mod cleaning-frequency = 0) [
    let num-bacteria count bacteria-here
    if num-bacteria > 0 [
      ; Use slider value directly for kill percentage
      let kill-percentage cleaning-effectiveness

      ; Check if this counts as a "successful clean" (> 70%)
      if kill-percentage > 0.70 [
        set successful-cleans successful-cleans + 1
      ]

      ; Calculate kill count
      let kill-count floor (num-bacteria * kill-percentage)

      ask n-of kill-count bacteria-here [ die ]
    ]
  ]

  ; 2. VISUALIZATION LOGIC (Runs every tick to show growth)
  ifelse count bacteria-here = 0 [
    set pcolor white
  ] [
    set pcolor scale-color yellow count bacteria-here 0 30
  ]
end

to update-globals
  ; Calculate stats without overwriting slider variables
  let current-population count patients
  set current-infected count patients with [infected?]

  if current-population > 0 [
    set percent-total-infected (current-infected / current-population)
  ]

  set total-bacteria count bacteria
end